


 9 / 170

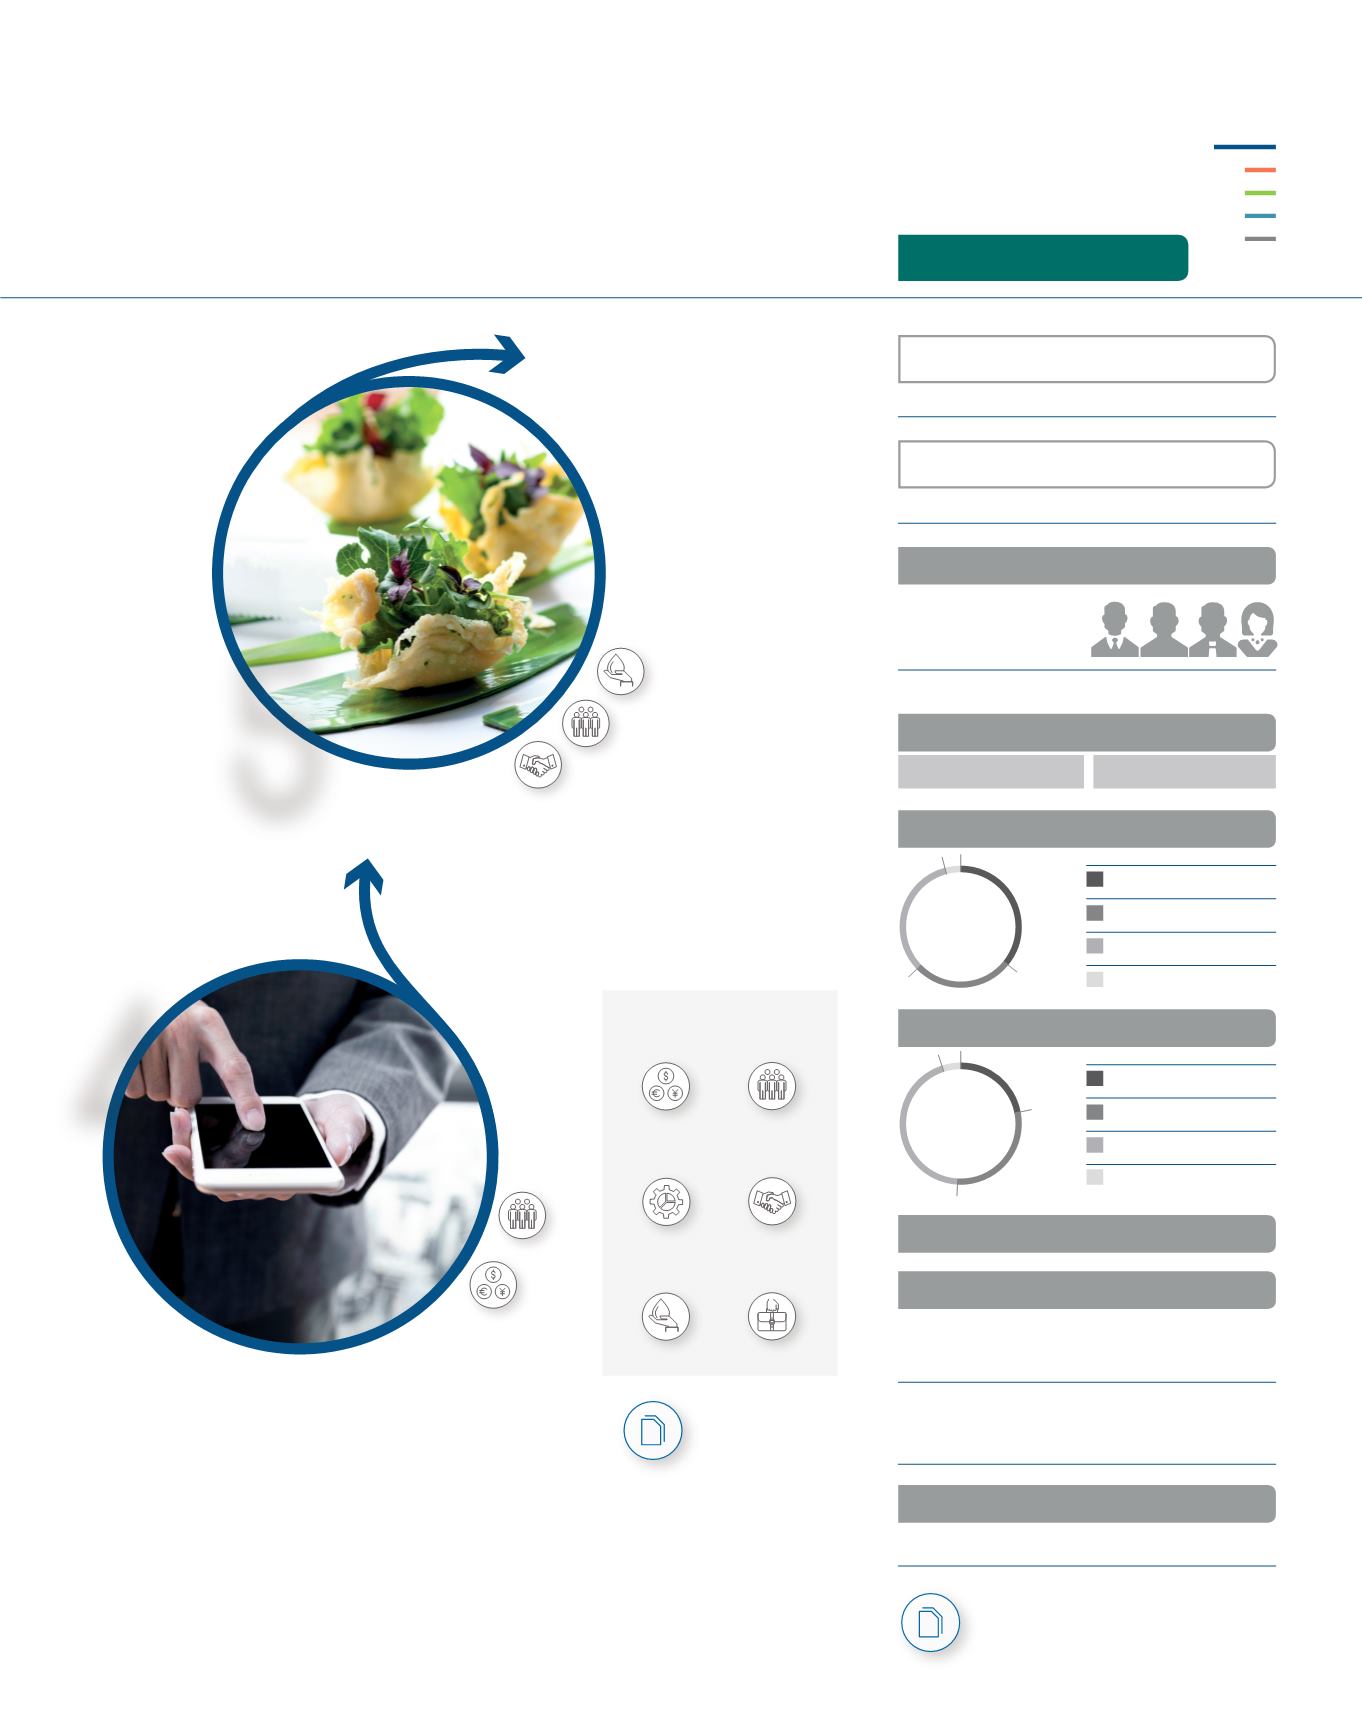
Real value is found on the plate.
Foodservice deliveries to hotels,
restaurants, caterers and institutions.
Using technology and e-commerce platforms
to deliver operational ef ciency. Implementing
smart solutions faster through sharing of
learning and ideas across businesses.
Upgrading, modernisation and simpli cation
of IT infrastructure such as online ordering
and routing distribution ef ciencies.
H
o
r
e
c
a
–
t
o
m
a
r
k
e
t
I
n
n
o
v
a
t
i
o
n
4
5
Divisional information is available
on pages 22 to 29.
P
00
www.
We plan to become industry leaders in terms of driving innovation,
customer friendly solutions and quality service delivery.
Capital
descriptions
available on
contents page.
P
00
www.
F
Capitals affected
Intellectual
Social Relationship
Manufactured
Financial
Human
Intellectual
Intellectual
Social Relationship
Manufactured
Financial
Human
Natural
Manufactured
Intellectual
Social Relationship
Manufactured
Financial
Human
Natural
Social and
relationship
Intellectual
Social Relationship
Manufactured
Financial
Human
Natural
Natural
Intellectual
Social Relationship
Manufactured
Financial
Human
Natural
Financial
Intellectual
Social Relationship
Manufactured
Financial
Human
Natural
Human
Group totals
Fuel usage – kilolitres
Diesel (excl biodiesel) usage
2016:
66 707
2015:
63 242
Gasoline (petrol) usage
2016:
3 845
2015:
3 374
24 064
2015:
23 639
Total employees for 2016
Distribution vehicles
4 844
Product segmentation
Frozen
36%
Chilled
27%
Ambient
33%
Non-food
4%
36
27
22
29
44
5
33
4
Market segmentation
Logistics
22%
Chain
29%
Independent
44%
Retail/other
5%
36
27
22
29
44
5
33
4
Total
259
m
2
1 254 895
Distribution centres
2016:
1 033 732
2015:
1 043 453
Total water usage – kilolitres
2016:
R140,5 bn
2015:
R116,3 bn
Pro forma revenue
2016:
R5,2 bn
2015:
R4,1 bn
Pro forma trading profit
Group overview
Bidcorp Limited Annual integrated report 2016 |
Page 5